
Where Does Your Money Go?
We are proud to say that by donating to Farmers Helping Farmers, your donation goes directly to Kenya.
We are a volunteer based organization with 3% administration fees in 2024/25 - which is extremely rare with NGOs. So you can have confidence in knowing that what you donate will go directly to the cause.
See for yourself!
Here is the income and expense breakdown for the 2024-2025 fiscal year.
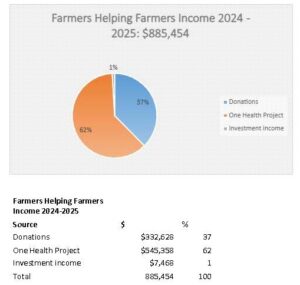
Revenue
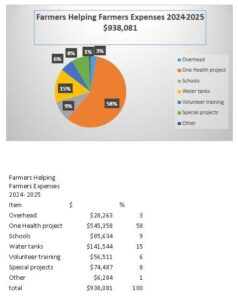
Expenses
Revenue
- Receipted donations $206,085 (84%)
- Non-receipted donations $29,343 (12%)
- Gifts from other charities $6,075 (2%)
- Government funding (0%)
- All other revenue $4,523 (2%)
- Total revenue: $246,026
Expenses
- Charitable program $250,250 (91%)
- Management and administration $14,654 (5%)
- Fundraising $11,453 (4%)
- Political activities (0%)
- Gifts to other registered charities and qualified donees (0%)
- Other $0 (0%)
- Total expenses: $276,357
This is the expense breakdown from Canada Revenue Agency for the year ending March 31, 2017.
Revenue
- Receipted donations $171,478 (76%)
- Non-receipted donations $31,754 (14%)
- Gifts from other charities (0%)
- Government funding (0%)
- All other revenue $22,404 (10%)
- Total revenue: $225,636
Expenses
- Charitable program $232,919 (91%)
- Management and administration $11,012 (4%)
- Fundraising $11,137 (4%)
- Political activities (0%)
- Gifts to other registered charities and qualified donees (0%)
- Other $0 (0%)
- Total expenses: $255,068
This is the expense breakdown from Canada Revenue Agency for the year ending March 31, 2016.
Expenses
- Charitable program $301,290 (93%)
- Management and administration $12,943 (4%)
- Fundraising $8,582 (3%)
- Political activities (0%)
- Gifts to other registered charities and qualified donees (0%)
- Other $2 (0%)
- Total expenses: $322,817
This is the revenue/expense breakdown from Canada Revenue Agency for the year ending March 31, 2015.
Revenue
- Receipted donations $132,010 (80%)
- Non-receipted donations $22,709 (14%)
- Gifts from other charities $705 (0%)
- Government funding (0%)
- All other revenue $9,237 (6%)
- Total revenue: $164,661
Expenses
- Charitable program $180,906 (95%)
- Management and administration $5,950 (3%)
- Fundraising $3,558 (2%)
- Political activities (0%)
- Gifts to other registered charities and qualified donees (0%)
- Other $0 (0%)
- Total expenses: $190,414